For research assistants and summer law firm associates, a frequent, yet intimidating, request goes something like this: “Can you figure out what the law is on Topic X in every state?” As a reference librarian, one of the most satisfying moments in my job is getting to tell a stressed-out recipient of this request that they do not need to dive into all 50 state codes; instead, 50 state surveys aggregating this information are often available. For an excellent look at some of the available resources for locating 50 state surveys, I recommend reviewing Tom Gaylord’s 2018 post for this blog. Today, I would like to take a deeper dive into one of these resources, HeinOnline’s Subject Compilation of State Laws.
Subject Compilation of State Laws (SCSL) is available through the Pritzker Legal Research Center’s list of databases, and a link is also provided within the right-hand column on the HeinOnline landing page. SCSL provides citations and, oftentimes, links to the full-text of resources that compare the laws of multiple states on a given topic. To get started, I recommend selecting the “Browse the Subjects” button, then navigating the alphabetical list to find your topic.
For example, using the alphabetical list, we can scroll down and choose “Electioneering.” At this point, we retrieve a list of 18 results, the first of which is a summary of and link to a resource from the National Association of Secretaries of State, entitled “State Laws on Electioneering Boundaries.” If we continue working our way down the list, we also find links to the full-text of academic law review articles, as well as citations to relevant court briefs.
SCSL can be incredibly useful, but a few qualifications are in order. First, the number of available results depends on the topic you are researching. In our “electioneering” example, SCSL provided us with 18 quality leads for our research; however, for some topics, you may find that only a few resources are listed, and they may be quite dated. Second, many of the resources identified in SCSL, including law journal articles and court briefs, are static. So, it will be necessary to update and verify any information you locate to make sure it is still accurate. Finally, many of the resources listed in SCSL are only citations, so it will be necessary to track them down after the fact (if you need help with this, feel free to ask a librarian). Despite these potential drawbacks, though, SCSL is a tremendous resource to keep in mind when you need to identify the laws on a topic in multiple jurisdictions.
The Documentary History is composed of three main parts: 1) Constitutional Documents and Records, 1776-1787 [Vol. I]; 2) Ratification by the States [Vols. II – XII & XIX – XXIX]; and 3) Commentaries on the Constitution [Vols. XIII – XVIII]. Although the digital edition is not rendered as a PDF, it retains the page numbering from the print volumes, facilitating citation.
The Documentary History is an important resource for the interpretation of the U.S. Constitution, and has been cited in the Supreme Court as recently as Justice Thomas’s concurrence in Dep’t of Homeland Security v. Thuraissigiam on June 25, 2020. Users can search by keyword(s) or browse, and each volume also contains an index.
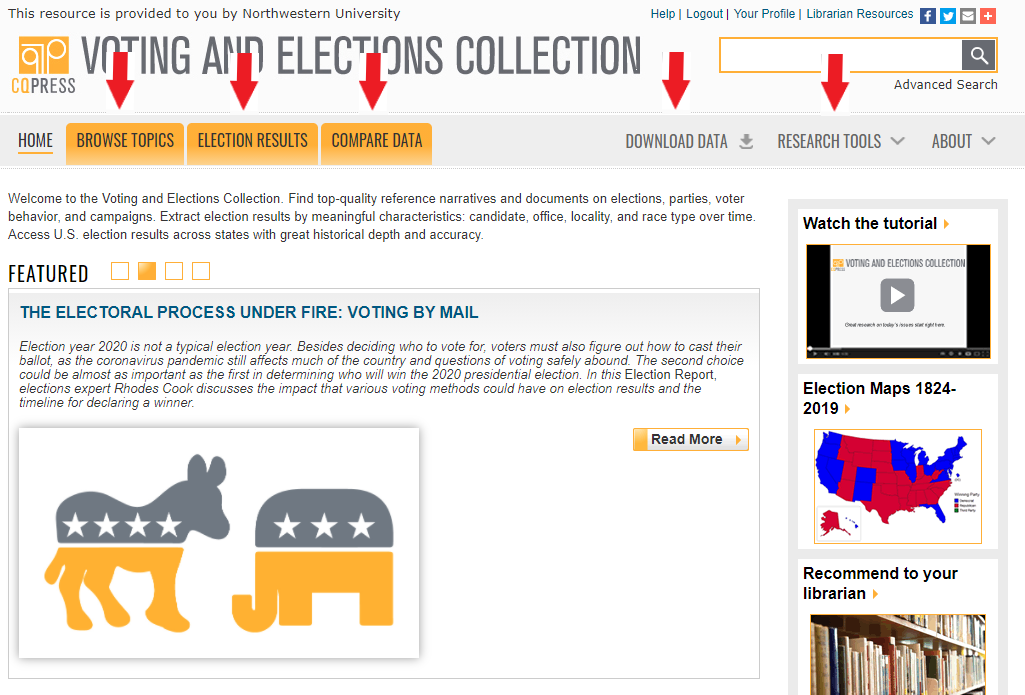
With only one week to go until the extraordinarily contentious 2020 general election, CQ Voting and Elections Collections (CQ VEC) allows curious minds to easily dig into key aspects of past American elections.CQ VECpulls together local and national data on campaigns, elections (including SCOTUS), political parties, voters, and demographics into statistical, analytical, and descriptive reports. You can also manipulate the raw data into dynamic, customizable (and exportable) reports. Coverage includes 1789-present (president); 1968-present (gubernatorial, senate, house).
CQ VEC Homepage
While there is a search bar in the top right corner of the homepage that will pull results from across the entire database, there are also 5 menu tabs that categorically slice subject content from data reporting. Under “Browse Topics” you’ll find the highest level categories of all the content available: Campaign and Election Process; Congressional Elections; Gubernatorial Elections; Political Parties; Presidential Elections; and Voters and Demographics. These headings further breakdown into lists of all related content and is a good way to explore what’s available. The “Election Results” tab allows a user to pull results from specific presidential, gubernatorial, house, or senatorial elections. The results can be limited by keyword, election type, region, and year, and the data will breakdown to the county and district levels if reviewing state election results.
By clicking into “Compare Data,” you can use the tools to profile candidates, identify race trends, and see changes in party dominance over time. For each candidate, including third-party candidates, the report will include which office they ran for, the number and percentage of votes received, and whether they ran as an incumbent or challenger. You can also see party affiliation changes. Vote counts by party, office, and area as well as elections with open seats, landslide elections and close races, and more can be found in the race trends data. Party dominance reports will show changes in power over time with voter breakouts down to the district level. Pulling these reports takes only a few seconds, which is incredible given how much historical data is being sifted, and layering the insights each report reveals provides a powerful vehicle for making analytical deductions on various, pre-defined datasets.
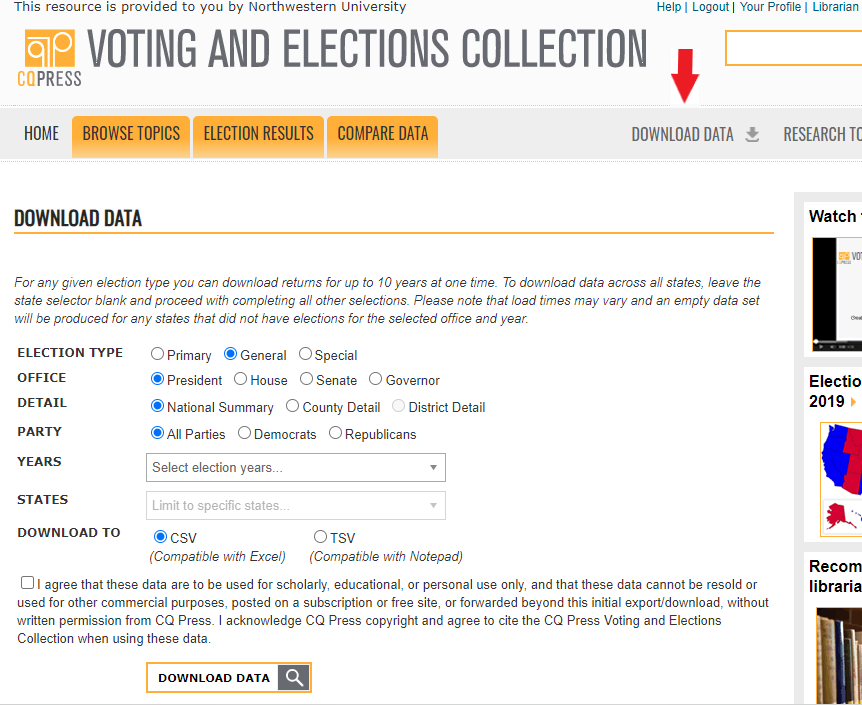
Run your own data reports under “Download Data”
What if you want to customize your own choice of data? Under the “Download Data” tab, you can choose from election type, office, level of detail, political parties, and years to pull 10 years of raw data. Once the report is pulled within the database, it can be exported to Excel in a click. The last tab, “Research Tools,” features encyclopedia articles defining and explaining election terminology, concepts, and historical developments (see Watershed Elections, for example). Also included are Election Reports, brief but heavily informative articles written by CQ analysts covering historical developments (see Supreme Court’s Shifting Views on Voting Rights) through contemporary issues (see The Electoral Process Under Fire: Voting by Mail). Biographies, Facts & Figures sheets, and historic documents (see Governor Palin and Senator Biden in the Vice Presidential Debate, Oct. 2, 2008) and primary sources like transcripts of addresses are a few of the other categories of materials available under “Research Tools.”
For those seeking visualized data, national general election maps from 1824 – 2012 are available, as are state maps with county boundaries for presidential, gubernatorial, and Senate elections from 1980 to present, and state maps with district boundaries for House elections beginning in 1998. After selecting the type of election and year, a color-coded national map will appear with voting results displayed by winning political party. By rolling over any given state, a pop up will appear with a detailed breakout of each candidate’s results. By clicking any given state, a state map will appear and the detailed pop up will now include the local results of each county.
One major drawback about CQ is the extended delay in publishing to ensure data integrity. While there are articles as recent as late September 2020 to be sure, there is also a lengthy process of data collection, standardization, and reconciliation that CQ experts undertake after the results of an election have been certified. If not for this rigorous adherence to data uniformity, the offered data reporting would not be comparable. Additionally, the staggering amount of variance in electoral processes from state to state also means states certify and release official election results at different times, further contributing to a publishing delay. According to CQ VEC’s 2020 Primary and General Elections Data Publication Schedule, “all 2020 primary and general elections should be up by August 2021.” Some will be released before then, but because it will be nearly a year delay for the 2020 election, this resource best serves historical election data research purposes.
The database contains full-color, full-text searchable digitized primary source materials on the history of Jewish communities in America from their first arrival in New York in 1654 to today. It draws on the archives of the American Jewish Historical Society, New York. Founded in 1892, it is the oldest national ethnic historical organization in the United States and maintains an archive of more than 20 million documents, 50,000 books, photographs, art and artifacts.
Per Adam Matthew Digital, the database publisher, the collection provides insight into the following key topics in the history of Jewish communities in America:
The evolution of early Jewish Settlements in areas such as New York, Rhode Island and Philadelphia.
The immigration process and structures of support for those arriving from the Old World – the differing experiences of immigrants and, from the late 19th century, strategies adopted at Ellis Island and in Galveston.
The role of Jews in the American War of Independence and the Civil War.
The role of the synagogue as a focal point for Jewish communities.
The development of Jewish schools and charitable institutions.
Westward expansion and the attempts to establish Jewish farms.
The Jewish Diaspora – the influx of Jews from Western Europe, Eastern Europe and other places around the world, and their dispersal across America.
The garment industry, peddling, general stores, finance and diversification into other industries.
The development of differing strands of Judaism in America – Reform, Conservative, Reconstructionism and Orthodoxy – and the roots of this in patterns of immigration and in societal changes.
Reaching out to Jewish communities around the world – especially to Russia, Romania, Germany and Eastern Europe.
American Jewish involvement in the Spanish-American War, the American Revolution, the War of 1812, the Civil War, World War I and World War II.
Involvement in Civil Rights and Minority Rights issues
If you would like to read more about the American Jewish Historical Society or the collections available in this database, see the Jewish Life in America User Guide provided by the publisher.
Thanks to Northwestern University Libraries for making this extensive collection available to the full Northwestern community. As a reminder, you can see other non-legal databases that we have access to courtesy of University Libraries via their A-Z database list.
If you hit a paywall when trying to access a news article, we have many electronic resources where you can likely access the full-text article instead.
For current articles from the Wall Street Journal, use this link to access the WSJ website. Initial access requires you to register with your Northwestern email address, then subsequently you may log in with your NetID and password.
Northwestern Law students, faculty, and staff can access all Financial Times content directly at FT.com after registering for an account at this link.
Although our university does not have direct access to the websites for the New York Times and Chicago Tribune, you can access both current and historical versions of these and other popular newspapers through the links available in our News Sources research guide. Some of these resources even allow you to access PDF print replica copies of the articles. Alternatively, you can search for the name of the newspaper in NUsearch, and our library catalog will provide links to relevant databases and the coverage dates for those databases.
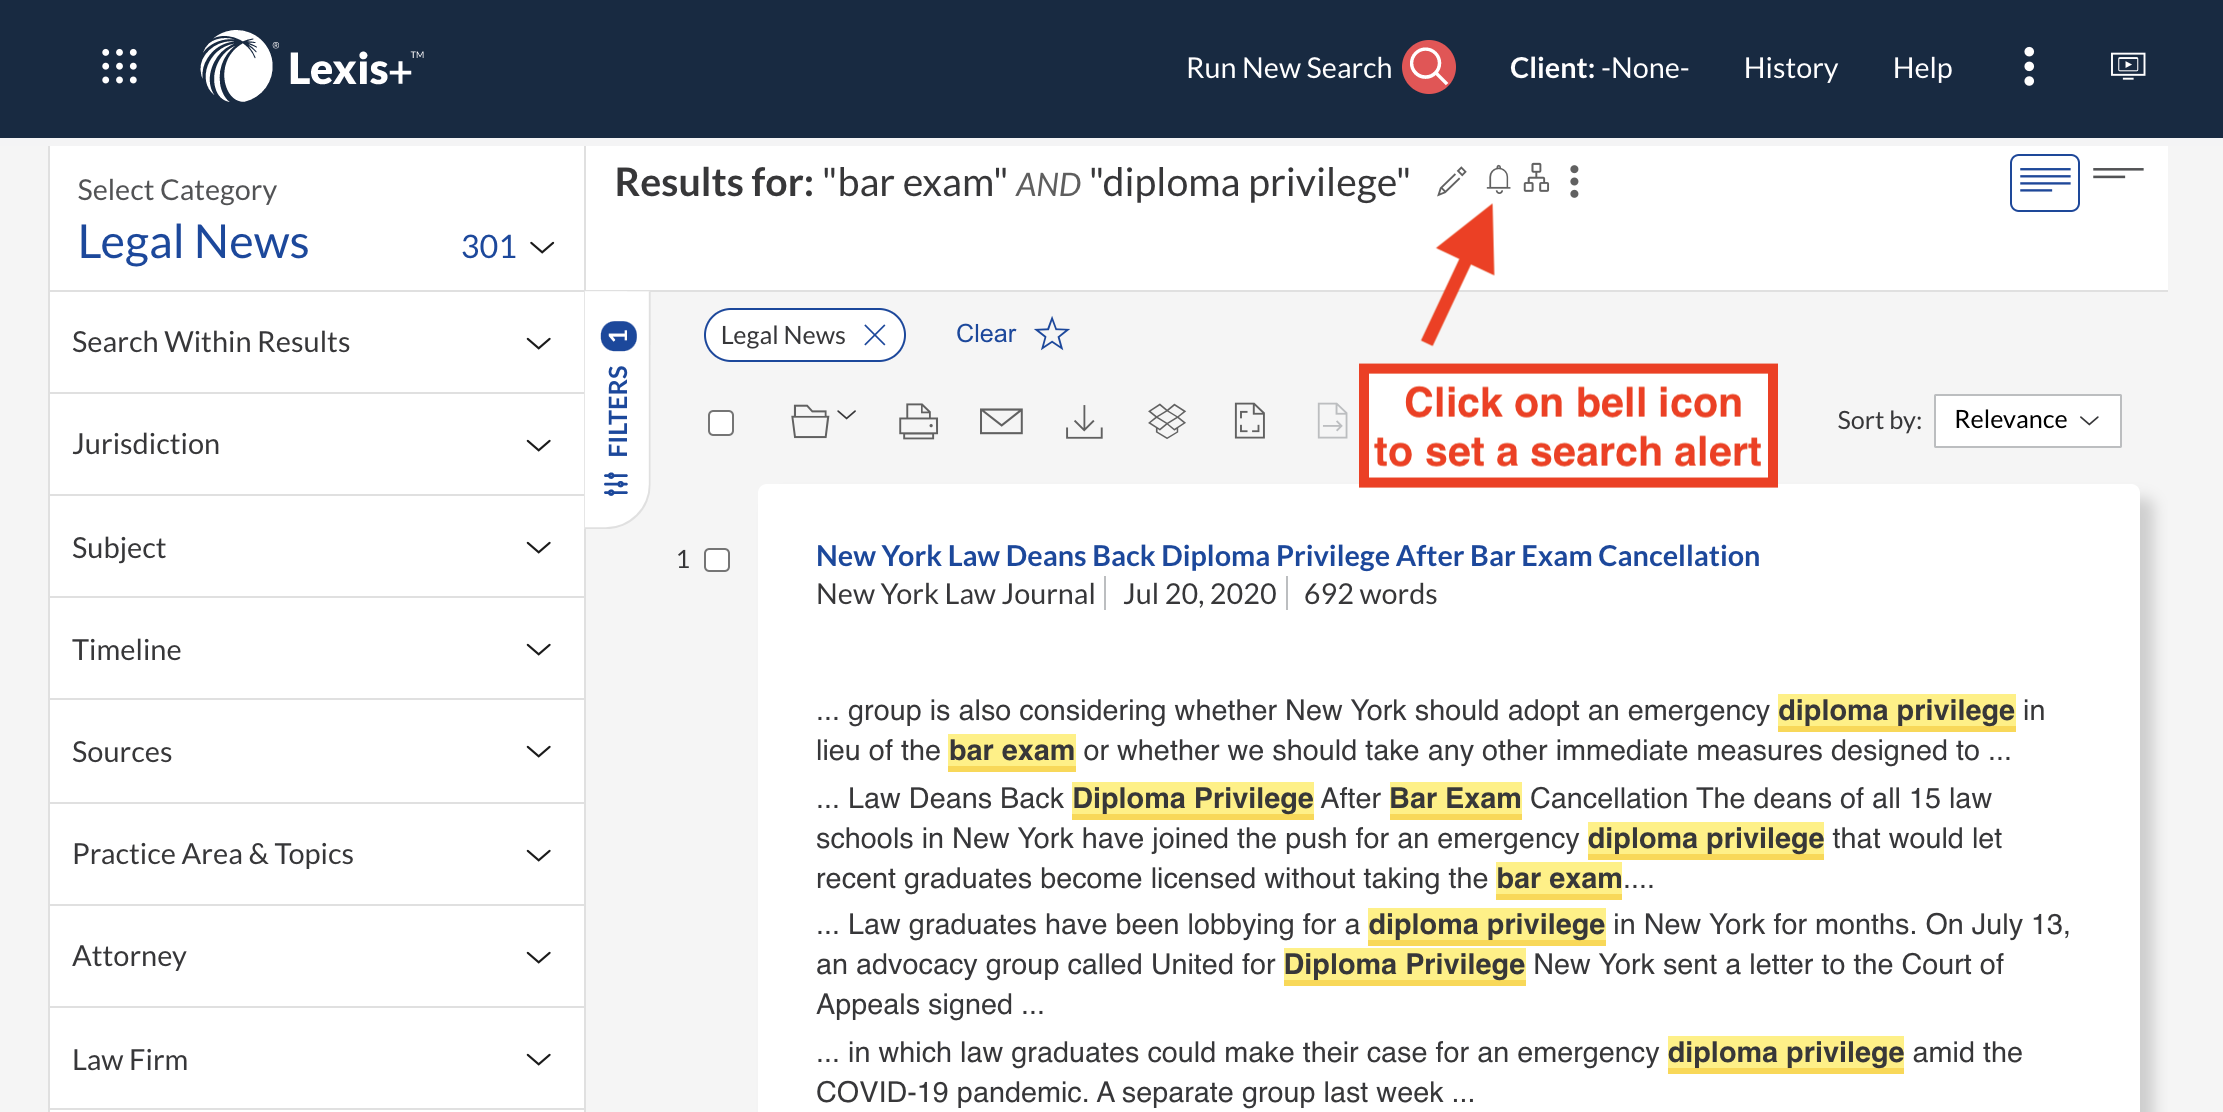
If you are interested in legal news, you can access Law360 content via this link. Additionally, Lexis Legal News also provides access to Law360 content as well as ALM Media publications such as The American Lawyer, The National Law Journal, and the New York Law Journal.
You can easily set alerts for news searches on Lexis by clicking on the bell icon after running a search. Your specified search will automatically run on the database, and Lexis will send you a notification when any new articles are published that meet your search criteria.
Lexis also provides access to articles from newspapers around the world in its News section. Browse for newspapers by country or region or search across a set of newspapers, such as major U.S. newspapers, or within a particular publication.
The authentication process that you’re used to for CAESAR is now a part of accessing library resources. This extra layer of security is great for our users because when just one password on campus is compromised, the entire university can lose access to that resource. It has happened more than once.
The extra layer of security, called multi-factor authentication, is easy to use and might actually make you feel like you’re living in the future. The non-dystopian kind this time.
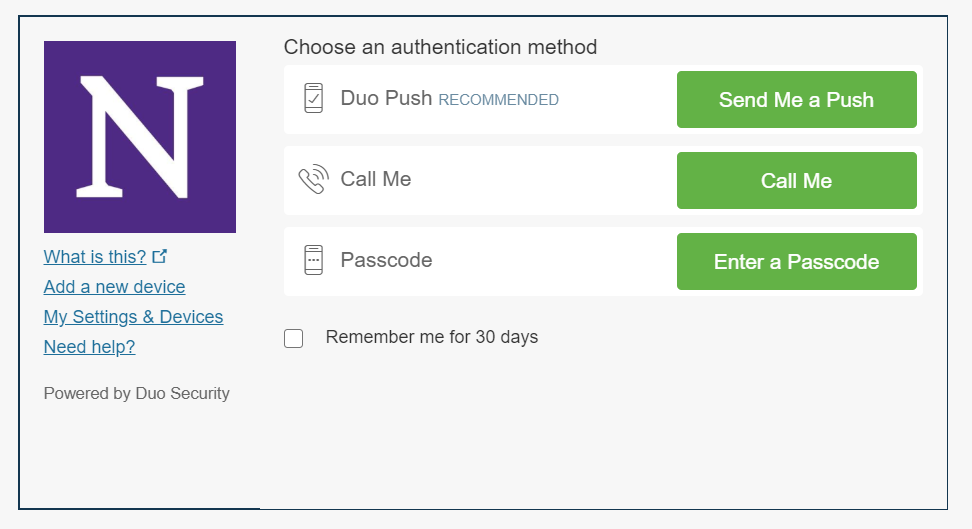
When you access a library resource, you’ll be prompted for your NetID and password, just like normal. You’ll then get a message that looks like this:
Multi-factor authentication screen
This screen gives you three options for how to get to your resource, but only one of them is good: “Send me a push.” You click that, it sends a notification to your phone or your watch (more on that later), you hit “approve” and you’re in. Better yet, you can click that “remember me for 30 days” box and you won’t even have to do that much for another month.
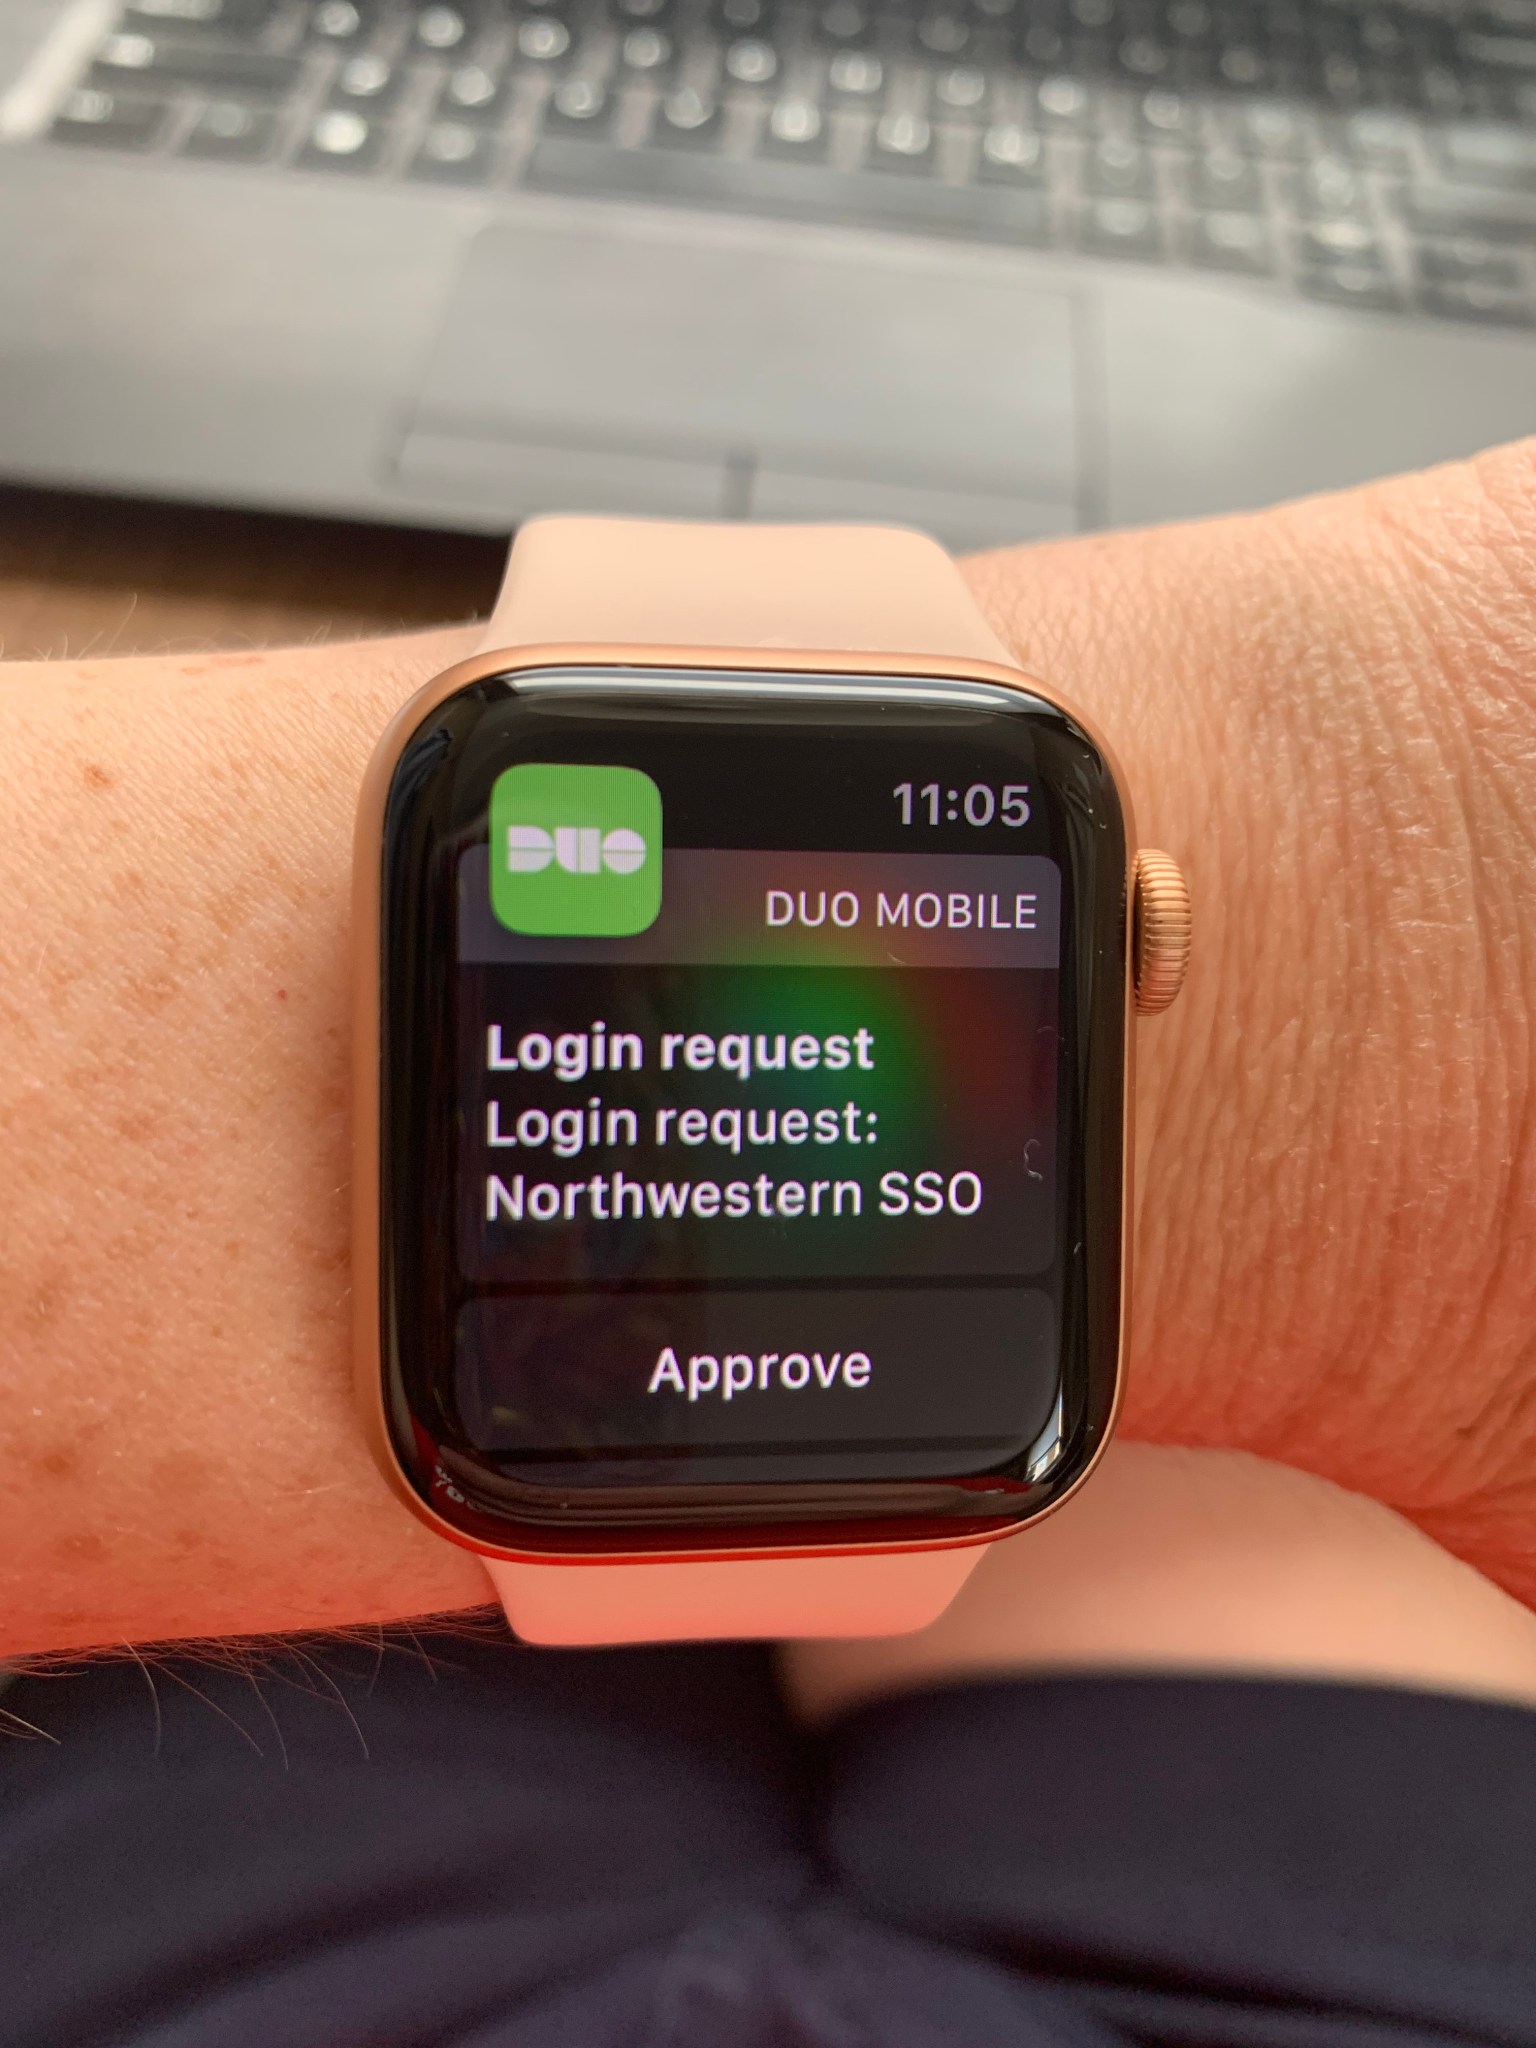
But I promised you that you could feel like you were living in a non-dystopian future. The app can push an alert to your phone, but it can also push an alert to your apple watch. That means you can be sitting at your laptop, request a push and see this:
My wrist, coming to you from the future
You can hit “approve” on your wrist and never have to figure out where your phone is. Just sit back and imagine yourself as one of the Jetsons.
Please feel free to contact the library if you have any trouble with multi-factor authentication. So long as you use the Duo app, I think you’ll find it’s a seamless and easy experience.
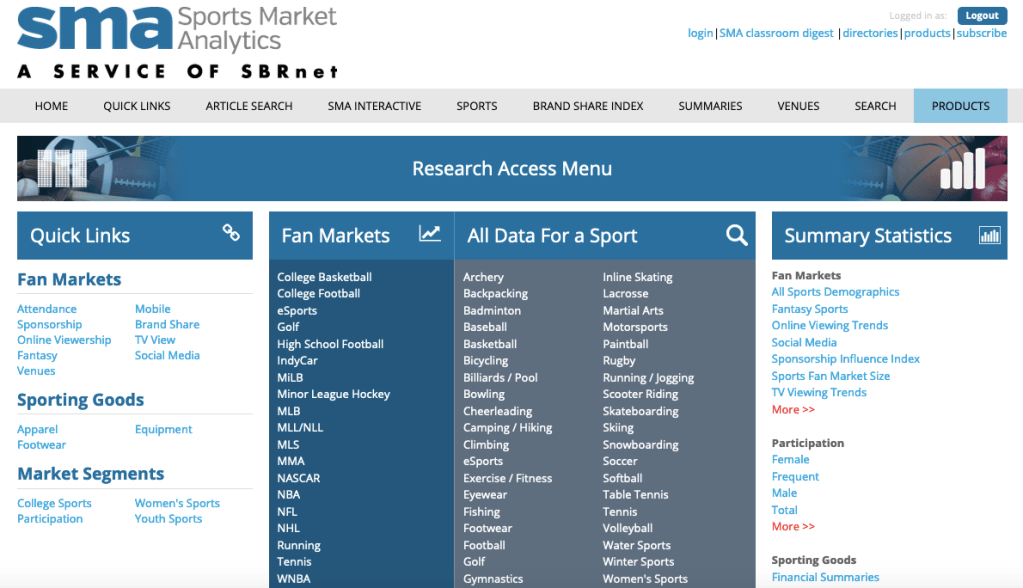
Coinciding with the exciting news that Major League Baseball will be returning in July, I would like to provide a brief overview of Sports Market Analytics, a unique resource for sports fans and researchers interested in the business and economic impact of sports. Law school patrons can access this database by entering their Northwestern Net ID and password or by using GlobalProtect VPN.
On the landing page, links are provided for some of the most popular data under the “Quick Links” and “Summary Statistics” headers, and it’s also possible to access fan market data for various professional and amateur leagues. Meanwhile, within the “All Data for a Sport” box, we find links to landing pages for 42 different sports.
From the baseball landing page, for example, we can review data on consumer expenditures and participation in the sport, as well fan market numbers for both Major and Minor League Baseball. If we select “Team Valuations” beneath “MLB Fan market,” we retrieve annual valuations of each team dating back to the 2010 season. Within “Brand Share-of-Market,” we find annual brand preferences for baseball fans, organized by product. For example, among baseball fans in 2019, Toyota was the most popular truck brand and Bud Light was the most popular beer. On the “Social Media Market Summary” page, we find interesting data such as the percentages of baseball fans who use Facebook, Twitter, and other social media platforms.
The database also provides data for professional and college sports venues. For example, if we select “Venues” from the ribbon at the top of the page, click “Venue Reports,” choose “RSV Pro Facilities Report’ from the “Venue Type” drop-down menu, and search for “White Sox,” we can retrieve information about the ballpark at 35th and Shields. Among other data, we find information about naming rights, ticket prices, luxury suites, and stadium financing.
Whether you’re conducting serious research or just looking for some fun facts relating to your sports teams, I think you’ll enjoy exploring Sports Market Analytics. And, for those interested more generally in sports law research, I recommend checking out the Pritzker Legal Research Center’s online guide to Dispute Resolution in Sports.
Our librarians are available to support faculty members with designing remote classes for the fall. From our experience teaching courses, giving guest lectures, and supporting faculty teaching, we have gained expertise with several tools and teaching techniques. We invite you to please contact your librarian liaison to learn more.
The library is happy to discuss our experience in these areas:
Creating and editing videos using Panopto, YouTube, Adobe Premiere Pro, and other tools.
Teaching synchronously on Zoom utilizing breakout rooms, polls, and icebreaker questions.
Creating asynchronous class sessions that integrate videos with quizzes and exercises.
Developing quizzes using tools like Canvas that let you write your own questions.
Locating study aids with questions written for you including CALI lessons and Quimbee.
Setting up discussion boards using Canvas and guiding in-class discussion in Zoom.
Leading student collaboration using tools like Google Drive and Mural, an online whiteboard.
We know many of you have been reading more about remote teaching and different online teaching tools. The university has compiled a Remote Teaching and Learning webpage. If you’d like to know whether we have access to something, please ask! The school has a license to popular tools like Poll Everywhere.
Contact your librarian liaison who can connect you with resources or expertise.
To assist Northwestern Law faculty, staff, and students with accessing books on racism, the law library has obtained e-books for many of the titles recommended on the Office of Inclusion & Engagement’s Racism Resources list, Ibram X. Kendi’s Antiracist Reading List, and Bridgette R. McCullough’s Booklist to Make Yourself Innocent.
We thank Bridgette McCullough (member of the NLaw community) and the Office of Inclusion & Engagement for sharing these resources as part of the Real Conversations: Racism, Allyship, and Police Reform program on June 3.
The following links are to e-books available through NU Libraries (please note that the publishers often limit the number of users who can access an e-book copy at a time, so access information is noted below):
With the semester over, a common question students have is how they can get access to Westlaw and Lexis. With the coronavirus pandemic upending everything, it’s fair to ask whether it’s upending access to your legal research tools as well. Here, for once, we have some unequivocal good news for you!
Bloomberg: Have you used Bloomberg? You may like it for docket research, sample documents, or secondary sources. Current students get access to Bloomberg all summer long with their current credentials. There’s nothing to register for. Graduating students get access to Bloomberg all the way until June 2021.
Lexis: Like Bloomberg, Lexis is giving current students access all summer. Graduates get access until February 8, 2021. Again, no registration required. Keep using your normal ID and password.
Westlaw: Westlaw’s access offer has more restrictions, but it’s still good. Current students have access for non-commercial purposes over the summer. What does that mean? Essentially, if you’re working for a law firm, the firm needs to get you a Westlaw password to use. If you’re using Westlaw for law review, clinic, or work for a non-profit, then you can you your current Westlaw password.
For graduates, the library subscribes to a Westlaw Practice Ready library that provides 18 months of continued access for graduates. This access gives you 60 hours of usage on these products per month. To extend access, graduates must log into lawschool.thomsonreuters.com. Choose “Grad Elite Status” from your homepage and press the “Extend Access” button.
All those other goodies? Current students have continued access to all of our other electronic resources like HeinOnline and Law360 via your NetID throughout the summer and graduates retain access for as long as your NetIDs remain active (through Oct. 2020).
If you have any questions about the ins and outs of these policies or if you want to talk about free or low-cost alternatives to these services, reach out to the library.


 Thanks to Northwestern University Libraries we have access to a new database,